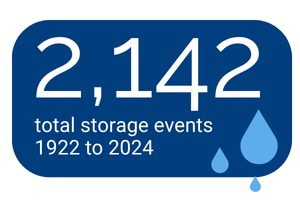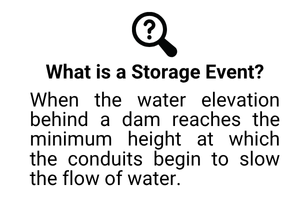
Our Main District is responsible for an integrated flood protection system that significantly reduces flood risk to property owners across five counties including riverfront communities along the Great Miami River and its tributaries.The system includes five dry dams, storage basins, 55 miles of levees, and preserved thousands of acres of floodplain. Together, the dams have stored floodwaters more than 2,100 times since construction was completed in 1922. The Miami Conservancy District's flood protection system is known around the U.S. and the world.
Learn more: History of MCD | The Conservancy Act | Great Flood of 1913 | Capital Improvement | Funding View Map Of The Flood Protection System
What does the system protect?
 Full vs. Partial Protection
Throughout the Great Miami River Watershed, the integrated flood protection system protects 22 cities, 5 counties, and 18 townships, and provides multiple benefits.
If a property is protected by dams, storage basins, and levees, it is considered fully protected. If a property is protected by dams and storage basins (no levees in your community), it is considered partially protected, and receive less benefit. Properties that flooded in 1913 and are now protected by the Miami Conservancy District flood protection system pay an annual assessment calculated using several factors including property tax values established by the county auditor.
Full & Partial Protection Maps by County
How much can the system store?
The flood protection system is designed to manage a storm the size of the Great Flood of 1913 (9-11 inches of rain in three days across the 4,000-square-mile watershed) PLUS an additional 40 percent.The total capacity of the flood protection system is called the "Offficial Plan Flood" and is 841,000 acre-feet or about 274 billion gallons of water.


Highest Amounts of Water Stored Since 1922
|
Ranked by size |
Date |
Amount of Water Stored at Peak |
Amount of Water Stored at Peak (Billion Gallons) |
|
1 |
Jan 22-23, 1959 |
137,600 |
44.8 |
|
2 |
Jan 6-8, 2005 |
114,450 |
37.3 |
|
3 |
Jun 11-15, 1958 |
97,690 |
31.8 |
|
4 |
Jan 14-16, 1937 |
93,300 |
30.4 |
|
5 |
Dec 21-24, 2013 |
93,300 |
30.4 |
|
6 |
Jan 21-23, 1937 |
93,200 |
30.4 |
|
7 |
May 13-15, 1933 |
86,900 |
28.3 |
|
8 |
Mar 5-7, 1963 |
86,690 |
28.2 |
|
9 |
Feb 26-27, 1929 |
84,300 |
27.5 |
|
10 |
Dec 31, 1990 |
81,300 |
26.5 |
|
11 |
Jan 27-28, 1952 |
71,800 |
23.4 |
|
12 |
April 3-12, 2025 |
68,950 |
22.5 |
Piqua
Troy
Tipp City
Miami Villa (Huber Heights)
Dayton
West Carrollton & Moraine
Miamisburg
Franklin
Middletown
Hamilton